


Business performance monitoring system
Turning Operational Data and Historical Activity Records into Continuous Improvement Indicators
Many organizations collect vast amounts of operational data every day. Requests, plans, completed activities, resource utilization and available capacity are continuously recorded across management systems, Excel files and corporate databases.
The challenge is not data availability.
The real challenge is transforming raw operational information into clear, objective and measurable indicators that provide a reliable understanding of how the organization is actually performing.
To address this need, a KPI Analytics Ecosystem was developed, combining structured data collection, historical archiving and Business Intelligence capabilities to monitor operational performance over time through KPIs, dashboards and advanced analytics.
From Data Collection to Business Intelligence
The platform was built around a simple concept: preserving not only the current state of information, but also its evolution over time.
Users work through dedicated Excel-based input forms that allow them to register requests, planned activities, operational results and process updates.
All information is stored in SharePoint Lists that act as the central repository of the system.
At regular intervals, typically once per month, the platform automatically captures a complete snapshot of the available data and stores it within a dedicated historical archive.
Over time, this approach creates a structured information repository that documents not only the current situation, but also the evolution of activities, workload and operational performance.
A Knowledge Base That Grows Over Time
Every update enriches the historical database.
Month after month it becomes possible to accurately reconstruct:
- requests received;
- planned activities;
- completed activities;
- resource utilization;
- available operational capacity;
- facility saturation levels;
- workload evolution.
The resulting historical archive is not used solely for traceability purposes. Instead, it becomes the foundation for KPI generation, trend analysis and performance monitoring.
The database therefore evolves from a simple archive into a valuable source of process intelligence.
Measuring What Really Matters
One of the core principles of the platform is the measurement of performance through objective indicators.
Within a testing environment, one of the most significant KPIs is the relationship between requested tests and completed tests.
By analyzing historical activity records, it becomes possible to understand how much of the requested workload has actually been delivered and how this indicator evolves over time.
The dashboard directly compares operational demand against actual output, immediately highlighting deviations and performance gaps.
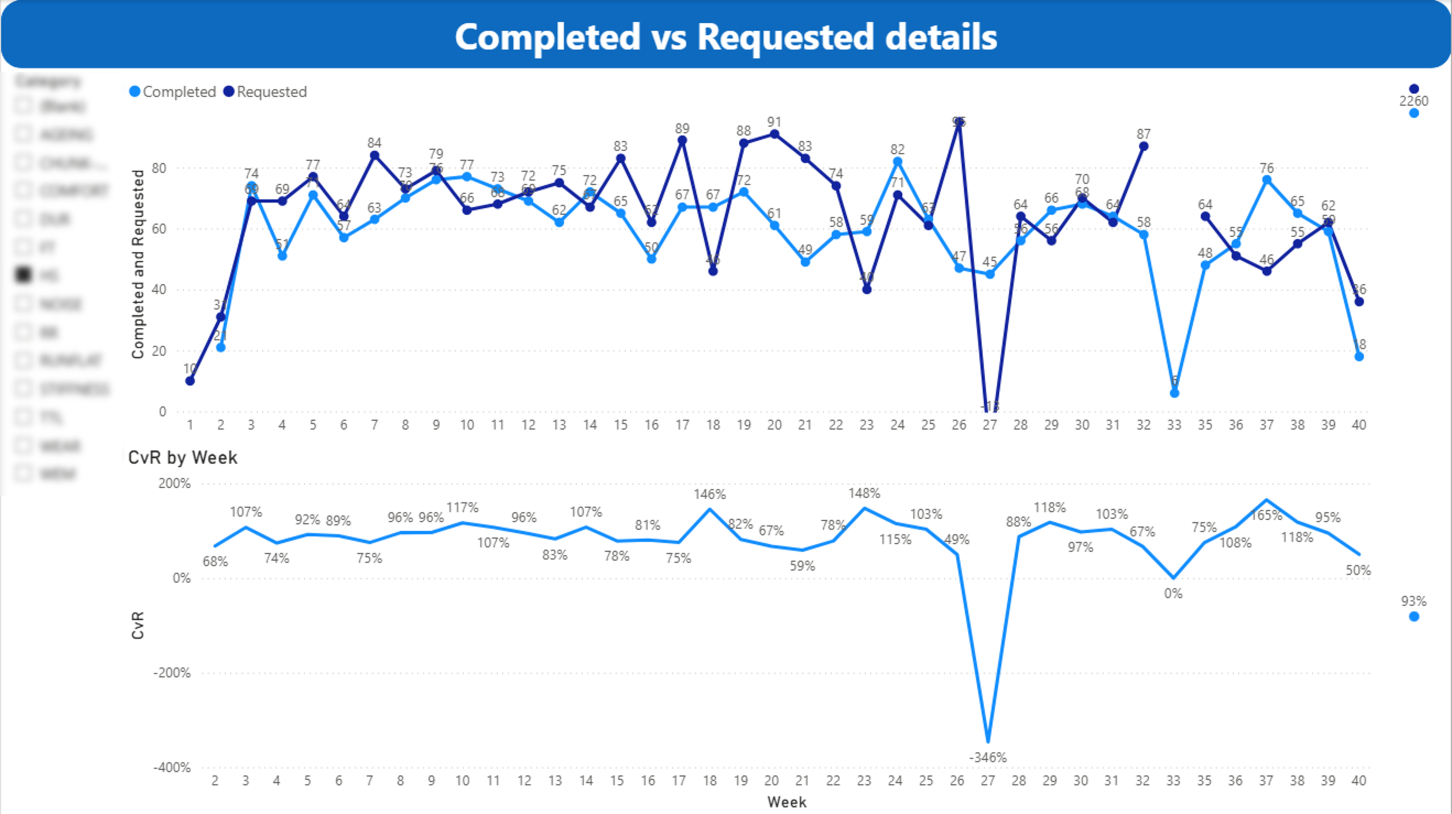
Analyzing results week by week allows managers to identify not only overall performance levels, but also periods characterized by bottlenecks, operational overload or reduced productivity.
From Requested to Completed
The availability of historical information allows the platform to generate KPIs that systematically compare incoming demand with actual delivery capability.
The dashboards provide visibility into:
- requested workload volume;
- completed activities;
- performance trends over time;
- operational variances;
- completion rates;
- weekly and monthly performance evolution.
Aggregated analysis by category enables managers to quickly identify high-performing areas as well as activities that require corrective actions.
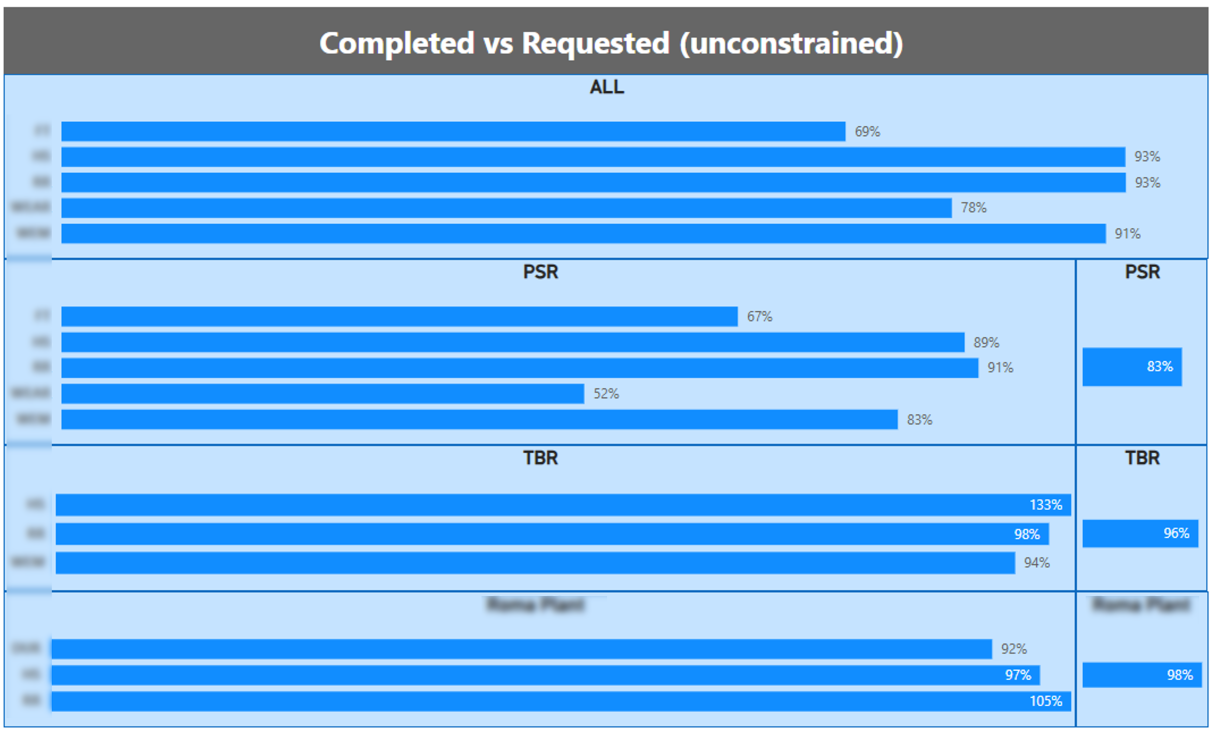
This approach provides an objective measurement of service delivery performance and operational effectiveness.
From Planned to Executed
A second KPI family compares planned activities against actual execution.
In this case, the platform measures how effectively the organization fulfills commitments and maintains planning stability.
The dashboards show which activities were completed as planned and which were delayed, cancelled or rescheduled.
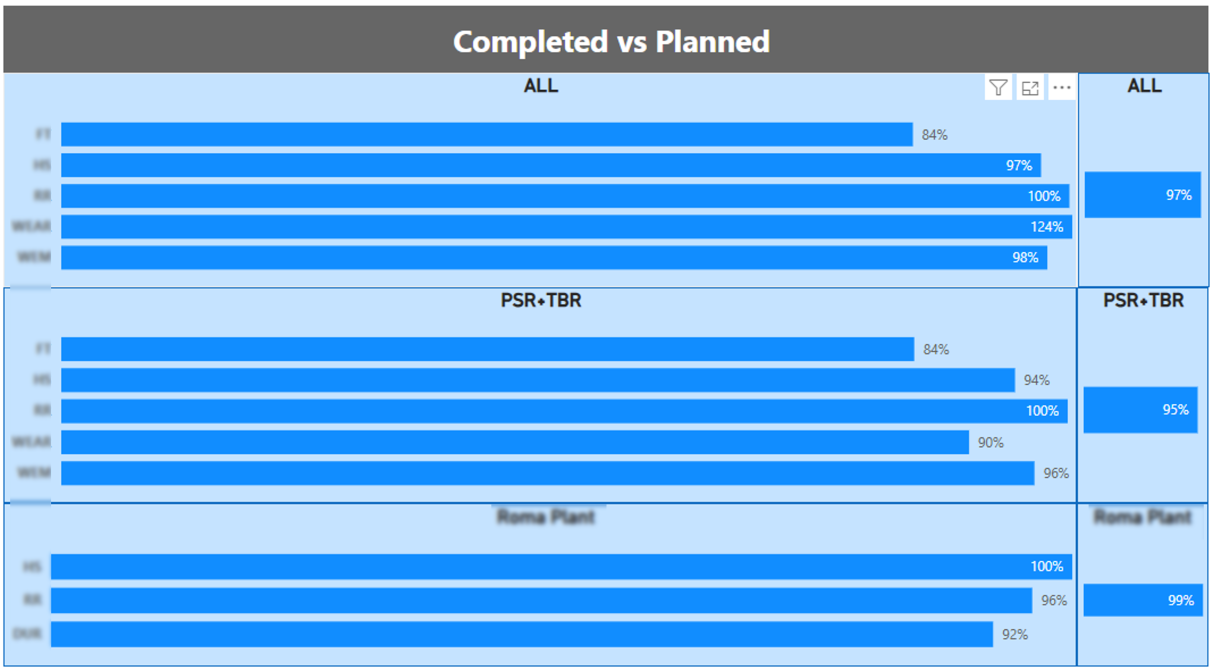
These indicators provide valuable insight into planning quality, schedule reliability and the effectiveness of resource utilization.
Analyzing Performance in Detail
One of the most powerful features of the platform is the ability to move seamlessly from a high-level overview to detailed operational analysis.
KPIs can be filtered and analyzed from multiple perspectives:
- activity category;
- operational area;
- work group;
- facility or machine;
- time period;
- test type.
For example, managers can analyze requested and completed workloads for individual machines or operational areas, identifying local performance patterns and capacity constraints. Data by machine is available through dedicated views Excel.
Users can navigate through different levels of aggregation, compare business groups, select specific timeframes and investigate KPI evolution over time.
The dashboards support:
- trend analysis;
- capacity monitoring;
- service level measurement;
- planning effectiveness evaluation;
- cross-functional performance comparisons;
- capacity planning decisions.
The same information can be consumed through both operational dashboards and executive-level management views tailored to strategic decision-making.
From Historical Reporting to Decision Support
The true value of the platform does not lie in report generation.
Its purpose is to provide managers and decision makers with objective tools to understand how the organization behaves over time.
Historical analysis helps answer strategic questions such as:
- Is available capacity sufficient to satisfy demand?
- Are specific areas consistently overloaded?
- Which activities generate the largest deviations?
- Are service levels improving or declining?
- Is planning stable or heavily affected by rescheduling?
By answering these questions through data rather than perception, organizations can move from reactive management to informed, data-driven decision making.
Conclusions
This ecosystem demonstrates how a complete KPI Analytics platform can be built using Excel, SharePoint, Power Query and Power BI.
Operational information collected on a daily basis is transformed into a structured historical database that feeds dashboards, KPIs and advanced analytical models.
The result is a system that goes far beyond measuring current performance. It enables organizations to understand how processes evolve over time, support more informed decisions and drive continuous operational improvement using objective, measurable and historical data. The dashboards and KPI views documented in KPI Indoor history.pdf illustrate this approach in practice.