


Test reporting and performance analysis
From test configuration to automated performance analysis
In the world of testing, preparing a technical report is not simply the final phase of a test, but the moment when data, operating conditions, and results are transformed into useful information to support technical decisions and development activities.
When the number of procedures increases and testing campaigns involve dozens of different configurations, manual documentation management quickly becomes complex. The same information must be reported in multiple documents, data must be kept consistent across different tests, and each report must comply with specific standards depending on the procedure performed.
To address this need, an integrated Test Reporting ecosystem has been developed that supports the entire document process, from the initial test configuration to the generation of comprehensive reports and automated performance analysis.
A single access point for all procedures
The system is organized around a home page that serves as a control center for the entire reporting process. From this screen, the user can configure the test, define the vehicle, identify the samples used, and select the procedures to be included in the report.
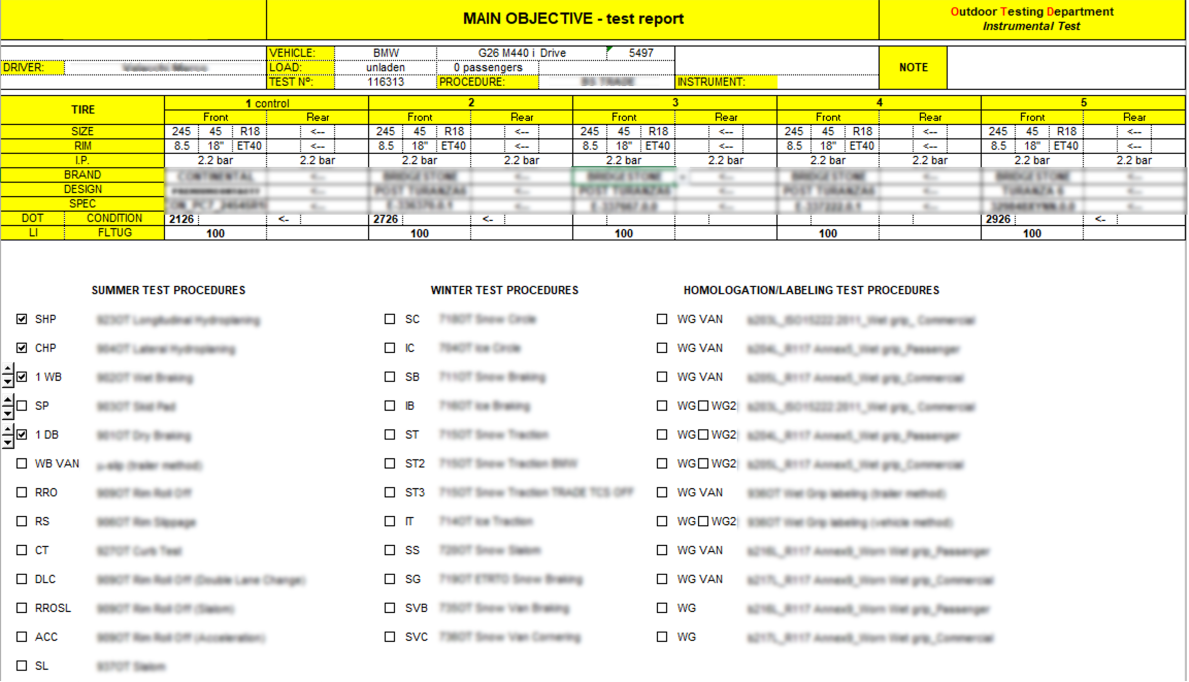
The same platform manages summer, winter, homologation, and labelling procedures, making it possible to prepare very different technical documentation within a common environment. Each procedure maintains its own technical specificities, but is integrated into a standardized structure that ensures uniformity and traceability.
An interface designed for the reporting process
Although the platform is developed within Excel, the user experience has been designed to approach that of a dedicated application.
To simplify daily activities, a customized toolbar has been created that gathers all the main functions used during report preparation and management in a single place.

The user is not forced to navigate through menus, sheets, and technical Excel functions: the most important operations are immediately available through dedicated buttons organized according to the natural workflow. The system thus guides the preparation of the report starting from data import, through the configuration of test procedures, up to the generation of the final document.
The toolbar also integrates tools dedicated to the automatic calculation of results, copying common information between different reports, updating statistical processing, and directly creating PDF versions of the technical documentation.
Particular attention has also been paid to system administration and maintenance activities. Dedicated functions make it possible to manage the sheet structure, update procedure configurations, and quickly check the status of the various modules that make up the ecosystem.
This approach significantly reduces the learning curve for users, standardizes operating procedures, and helps make the reporting process faster, more reliable, and easily repeatable.
In practice, the toolbar represents not just a collection of commands, but the access point to the main platform functionalities, transforming Excel into a specialized working environment for the preparation and analysis of test reports.
Centralized test configuration
Even before processing results, the system gathers all the information necessary to correctly identify the test.
Data such as test number, vehicle, driver, procedure, instrumentation, load state, and operating conditions are defined once and become immediately available within all associated reports. The sample report includes information such as request, facility, driver, procedures performed, application, test motivation, and vehicle characteristics.
This logic eliminates information duplication and significantly reduces the risk of transcription errors that often characterize the manual preparation of technical documents.
Complete management of test samples
The platform integrates tools dedicated to the detailed description of the samples used during the test.
Dimensions, rims, inflation pressure, brand, pattern, specification, sample state, identification codes, and traceability references can be recorded for each configuration. The report also maintains associations between the various tires, their respective positions on the vehicle, and their related TUG codes.
This approach makes it possible to maintain a direct connection between samples, test conditions, and final results, making any subsequent verification, comparison, and consultation activity easier.
From template to automated report generation
Once the procedures to be executed are selected, the system makes the relative report formats available and automatically coordinates their compilation.
Common information is shared among all sections of the document, while each procedure features specific layouts designed to accommodate the data required by the testing methodology. In the attached example, the same campaign generates sections dedicated to Longitudinal Hydroplaning, Lateral Hydroplaning, Wet Braking, and Dry Braking, maintaining graphic and document consistency across all results.
The platform thus guides the user along a structured path that reduces repetitive tasks and ensures higher quality in the documentation produced.
Automated results processing
One of the main distinguishing features of the system consists in its ability to automatically transform data collected during tests into easily interpretable technical indicators.
Average values, estimates, ratings, standard deviations, coefficients of variation, and performance comparisons are calculated and presented directly within the reports, reducing the need for external processing. In the sample document, these analyses are integrated into the sections dedicated to hydroplaning and braking procedures.
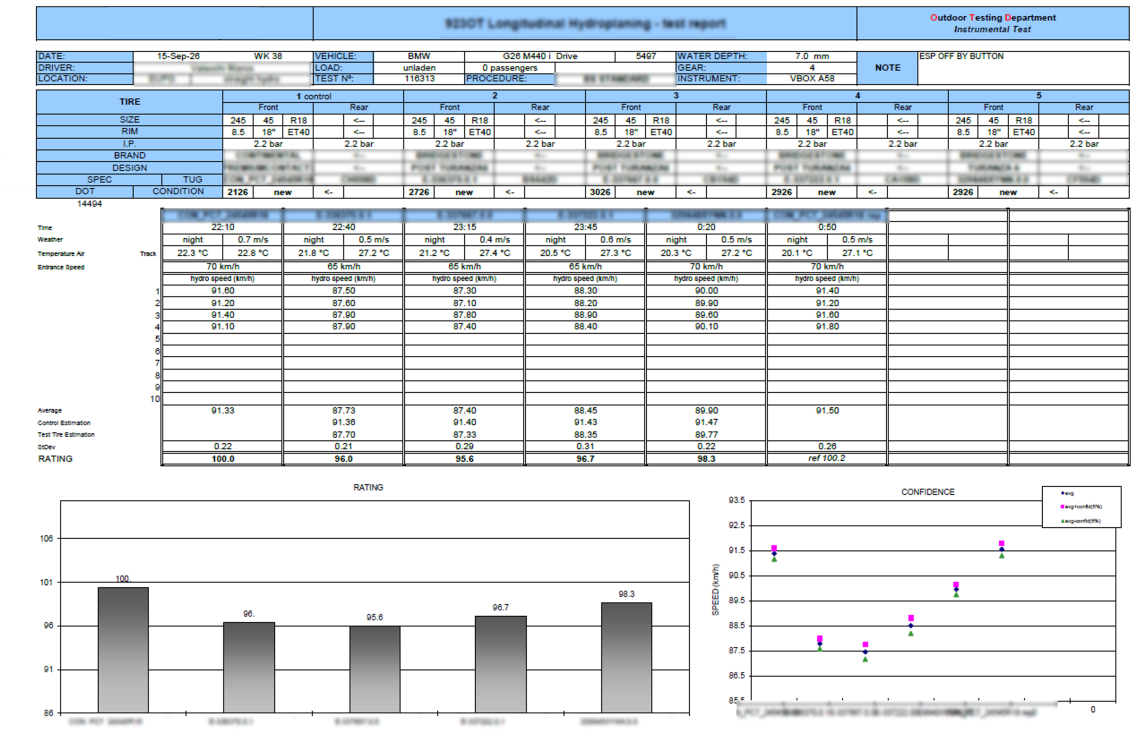
The goal is not simply to produce a final document, but to provide a working environment that supports technical analysis and fosters result interpretation.
Graphical performance analysis
Data collected during tests are automatically transformed into graphical representations that allow quick comparison of different samples.
Comparative charts and curves make it possible to visualize the relative behavior of the tested configurations, highlighting performance differences and operational trends that are difficult to identify through numerical data alone.
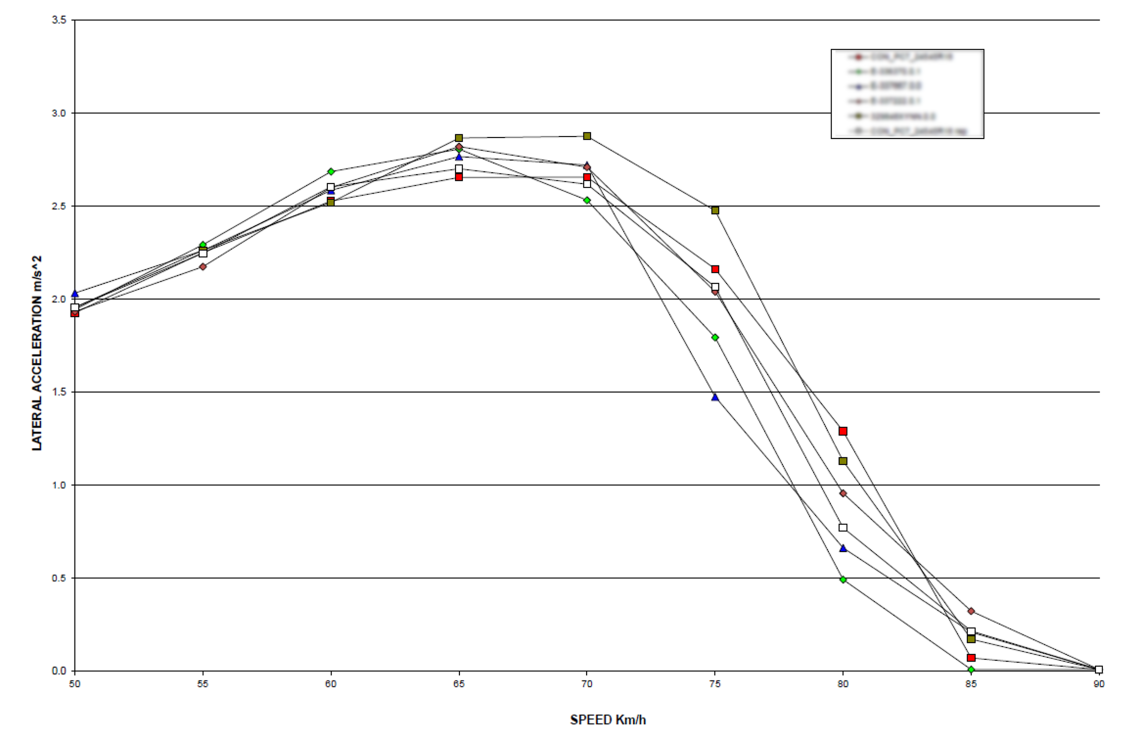
Graphical representation thus becomes an integral part of the analysis process, helping designers, engineers, and technical managers quickly identify strengths and areas for improvement.
Multispeed Analysis and advanced comparisons
In addition to standard procedures, the system integrates tools dedicated to the cross-sectional analysis of results.
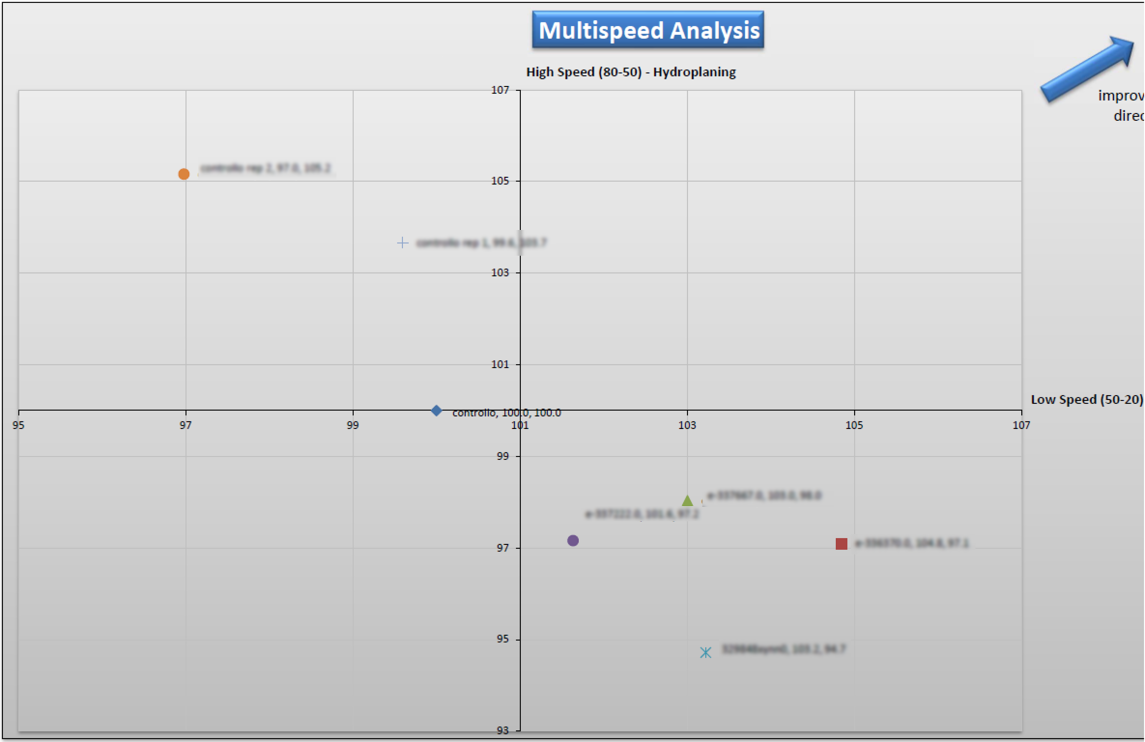
The sample report includes a Multispeed Analysis section that consolidates data from different operating conditions and makes it possible to compare the behavior of various specifications over a wide speed range.
Information is also synthesized through dedicated graphical representations that facilitate comparison between samples and highlight performance differences across various operating conditions.
This approach allows large volumes of experimental data to be transformed into information immediately available for development and validation activities.
Standardization without losing flexibility
Each procedure requires different content and specific analysis criteria. For this reason, the system has been designed to provide a common structure without limiting the technical requirements of individual tests.
General information, sample configuration, and test identification are managed according to uniform rules, while each procedure maintains its own technical structure, KPIs, and result representation methods.
The result is more consistent documentation that is easily comparable and at the same time flexible enough to adapt to very different testing contexts.
An ecosystem built around testing processes
One of the aspects that distinguishes this solution from a simple collection of templates is the fact that the system was designed starting from real testing processes.
Test configuration, sample description, result acquisition, statistical analysis, and report generation are all integrated activities within a single working environment. Information is automatically shared between different sections and remains consistent throughout the document lifecycle.
The platform therefore does not limit itself to producing technical documents, but helps improve the quality, reliability, and repeatability of the entire reporting process.
Conclusions
The Test Report Ecosystem represents an advanced approach to technical documentation preparation. Through a single platform, it is possible to configure tests, manage samples, activate formats associated with procedures, process results, and generate comprehensive reports complete with statistical analyses and graphical representations.
More than a simple set of Excel templates, it is an integrated ecosystem that transforms experimental data into structured information, supporting the entire journey from test execution to performance evaluation.